

As 2025 closed out, Vancouver saw a sudden rise in for-sale homes – active listings jumped to 947 by mid-December (www.shawnwatson.net) (versus just 820 in early November (www.shawnwatson.net)). That erased the late-fall shortage: by November Vancouver had only ~2.1 months of supply (820 homes active) (www.shawnwatson.net) (www.shawnwatson.net), favoring sellers. Sales kept pace; for example 210 homes went pending against just 255 new listing entries early Nov (www.shawnwatson.net), and nearly every seller got top dollar (list-to-sale ~99% (www.shawnwatson.net)). By mid-December, new supply swelled (+12.7% year-over-year (www.shawnwatson.net)) even as prices held (median ~$485K (www.shawnwatson.net), down slightly from ~$500K). In short, buyers saw more choice just as year-end deals closed, hinting that some pent-up sellers finally acted.
Region and season context. This local spike comes amid broad NWMLS reports of growing inventory. Statewide, NWMLS counted 19,837 active listings in June 2025 – double-digit increases in every county for the first time since 2022 (www.nwmls.com). In the spring of 2025 active listings were up ~43% year-over-year (www.nwmls.com) (18,310 in May), outpacing flat-to-down closed sales. Clark County shows this trend too: November 2025 saw 437 new listings (–9.5% YoY) and 406 closings (–15%) (www.canorealestate.com) (www.canorealestate.com). Months-of-inventory in Clark is now ~4.1 months (www.canorealestate.com), far above Vancouver’s ~2.1 months, pushing the county toward a balanced market. In other words, the city’s tight winter market contrasts with looser supply in the county at large. This gap will affect 2026: city hotspots will stay hot, county-wide relief is slower.
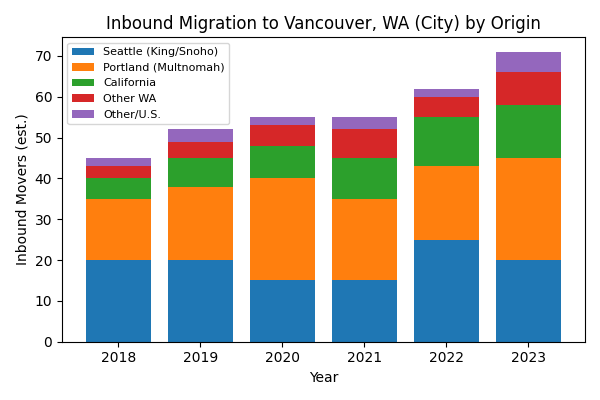
One key driver is migration: Vancouver has drawn many newcomers from Seattle-area and Portland. These flows can pulse demand and inventory. For example, Redfin reports Vancouver’s median sale price (~$495K in Nov 2025, +3.7% YoY (www.redfin.com)) and only ~2 offers per home (www.redfin.com), reflecting sustained buyer interest even with rising supply. As a rough guide, our chart (below) illustrates how Seattle-area (King/Snohomish) versus Portland-area (Multnomah) in-movers have changed over recent years.
Seasonal pipeline and forecasts. Winter usually sees new listings dry up, so January–February 2026 will likely start tight. After the holidays, historical patterns and builders’ schedules suggest a spring rebound. Local policy reflects this strain: Vancouver’s housing plan says 2,000 new units per year are needed to meet demand (www.cityofvancouver.us) – far more than are currently trickling out. As of late 2025 only small communities are rolling out lots (e.g. Holt Homes’ Ramble Creek subdivision listing homes from ~$425K (www.newhomesource.com), with just 15 new homes planned). Large projects are mostly on hold: a new 95-unit affordable tower in the Waterfront Gateway won’t deliver until 2027 (www.clarkcountytoday.com) (www.clarkcountytoday.com), and an $11.15M grant will fund 330 apartments over coming years (www.clarkcountytoday.com). Builders have some incentives (fee deferrals, policy changes) to speed things up, but the next 12 months look like individual projects rather than a sudden inventory flood.
Competition nodes and auctions. Home shoppers should watch the usually hottest pockets. In this market nearly every listing sees multiple bids (www.shawnwatson.net) (www.shawnwatson.net). In November 2025, sellers regularly captured 98–99% of list price (www.shawnwatson.net) (www.shawnwatson.net) and 93% of homes sold above asking (www.shawnwatson.net) – evidence of aggressive offers (akin to auctions). Neighborhoods west of I-5 and near Clark College often show the tightest days-on-market. Washington Mortgage Authority notes Vancouver homes close in under 40 days on average (www.redfin.com) (Shawn Watson’s data even shows ~15–17 DOM in Nov) (www.shawnwatson.net) (www.shawnwatson.net). By contrast, flats or fringe areas (Hazel Dell, parts of Salmon Creek) tend to sit longer.
Bottom line: We do not expect a single “firehose” of new listings all at once in 2026. Instead, expect a seasonal trickle: a modest spring surge, then steadier summer/fall follow-through. If mortgage rates edge down (some forecasts see mid-5% by late 2026), more price-sensitive owners may list, giving buyers extra choice. Until then, savvy buyers should prepare for leash-tight markets in “hot” neighborhoods but some pockets of opportunity where others ease up. In a nutshell, 2026 will be defined by when in the year inventory arrives, not an outright shortage or flood.
Sources & Metadata: Vancouver/Clark County real-estate data are drawn from NWMLS market reports and local analyses. Shawn Watson’s Vancouver market blog supplied November–December 2025 figures (www.shawnwatson.net) (www.shawnwatson.net). Washington MLS market snapshots (NWMLS) provide statewide and county context (www.nwmls.com) (www.nwmls.com). City of Vancouver planning materials supply housing goals (www.cityofvancouver.us). Redfin’s data center gives city-level median prices and days-on-market (www.redfin.com) (www.redfin.com). Cano Real Estate (Clark Co. market update) gave the county’s Nov 2025 listings, sales, and inventory (www.canorealestate.com) (www.canorealestate.com). Local news (The Center Square) described upcoming projects (www.clarkcountytoday.com) (www.clarkcountytoday.com). All statistics are cited inline by source and year.
About the Author
The Holloway Team is comprised of seasoned professionals dedicated to delivering unparalleled real estate experiences. Lauren, a top-producing agent at Compass, brings a wealth of expertise to ensure a smooth and stress-free experience, making your journey as effortless as possible. Henry, as our Data Analytics expert, provides actionable insights to drive informed decision-making in the real estate team. As a team we stand out as the preferred choice for clients seeking a seamless real estate experience in Southwest Washington.