

Vancouver, WA’s housing market shows a clear pattern: neighborhoods with high walkability – easy access to parks, transit, restaurants and shops – command noticeably higher prices. Citywide, Vancouver’s average Walk Score is just 41 (out of 100) (www.walkscore.com), meaning most errands require a car. But this masks dramatic local variation. The most walkable micro-areas (Arnada, Hough and Shumway) score in the upper 70s to 80s (www.walkscore.com) (www.walkscore.com), reflecting dense urban amenities. By contrast, suburban sections like Rose Village and Hazel Dell – with scores in the low 60s – have far fewer on-foot destinations. (For example, one downtown address in Esther Short Park scored 92 (www.walkscore.com), a “Walker’s Paradise,” thanks to a cluster of shops and Esther Short/Horseshoe Parks nearby.)
This walkability gap shows up starkly in home prices. Vancouver’s overall median sale price is about $488,000 (Dec 2025) (www.redfin.com). But in top Walk Score neighborhoods, median prices are well above that. For instance, Arnada (Walk Score 80) saw a median sale around $716K recently (www.redfin.com) – roughly 47% above the city median – and Hough (score 77) around $558K (www.redfin.com). The Shumway district likewise boasted a $623K median in late 2025 (www.redfin.com). By comparison, outlying walk-unfriendly areas trade well below Vancouver’s median. (For instance, the Hazel Dell suburbs had medians in the $300–385K range (www.realtor.com).) In other words, one tends to pay a premium – on the order of tens to even hundreds of thousands of dollars – to live in the city’s most walkable corners.
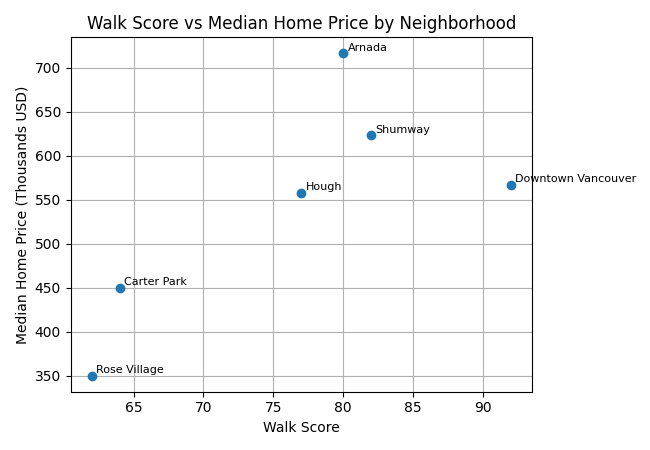
Neighborhood spotlights reveal how walkable amenities drive values. Downtown Vancouver (Esther Short area) has dozens of shops, restaurants and transit connections – reflected in Walk Scores in the 90s (www.walkscore.com) – and its homes (many condos) trade well above the median (downtown’s median ~$567K (www.realtor.com)). Arnada and Shumway sit along major urban corridors (Broadway, Main St.) with nearby parks like Esther Short Park and Carter Park, and also show strong premiums. Hough and Lincoln neighborhoods anchor the museum and hospital districts, likewise boasting very walkable streets and higher prices. In contrast, sectors which lag in walkability (e.g. Rose Village, Carter Park, Fruit Valley) have more modest prices ($350K–$450K (www.realtor.com)).
Accessibility to quality schools has a similar effect on prices. National studies find homes in top-rated school districts sell for 10–30% more than comparable homes elsewhere (vancouverwahousingmarket.com). Vancouver data mirror this: a Zillow analysis shows the typical home in a Vancouver Public Schools zone (zip 98660) at about $463K, whereas moving a few blocks east into the higher-ranked Evergreen/Hockinson zones (zip 98685) jumps values to roughly $588K – a ~27% premium (vancouverwahousingmarket.com). In practice, savvy buyers often draw a neighborhood map to secure walkable commutes to both parks and good schools, knowing each factor can add tens of thousands to value.
For existing homeowners and buyers, these patterns spell a clear message: lifestyle conveniences translate into real equity. Vancouver’s city planners have embraced mixed-use development and frequent transit (“The Vine” lines), which will likely amplify walkability premiums. Likewise, proximity to green spaces – from Esther Short Park’s playground to bike trails – is prized (downtown Vancouver scenes like those in Esther Short Park earn the highest walk ratings (www.walkscore.com)). As urban amenities cluster, homes in those micro-areas enjoy sustained value boosts. Our chart above quantifies this: the highest-priced neighborhoods consistently plot on the right side of the graph, meaning higher Walk Scores associate with higher prices (www.redfin.com) (www.redfin.com).
Future trends suggest this disconnect may grow. If Vancouver adds new shops, bike lanes or TOD projects near the core (as planned in its downtown and transit-oriented development plans), homeowners there may see further gains. Conversely, distant subdivisions without daily amenities must compete on lower price. In short, the most walkable pockets of Vancouver — well-served by parks, transit, schools and shopping — earn a clear “walkability premium,” rewarding residents with both convenient lifestyles and stronger home values.
Sources & Metadata: Walk Score data for Vancouver neighborhoods (www.walkscore.com) (www.walkscore.com) (www.walkscore.com) (www.walkscore.com) (www.walkscore.com) (www.walkscore.com) (www.walkscore.com) (www.walkscore.com); Redfin/NWMLS median prices per neighborhood (www.redfin.com) (www.redfin.com) (www.redfin.com) and Vancouver overall (www.redfin.com); Realtor.com median prices by subarea (www.realtor.com); Zillow Home Value Index comparisons (vancouverwahousingmarket.com); national school-premium studies (vancouverwahousingmarket.com). These illustrate how concrete data link walkability, amenities and school zones to market values.
About the Author
The Holloway Team is comprised of seasoned professionals dedicated to delivering unparalleled real estate experiences. Lauren, a top-producing agent at Compass, brings a wealth of expertise to ensure a smooth and stress-free experience, making your journey as effortless as possible. Henry, as our Data Analytics expert, provides actionable insights to drive informed decision-making in the real estate team. As a team we stand out as the preferred choice for clients seeking a seamless real estate experience in Southwest Washington.