
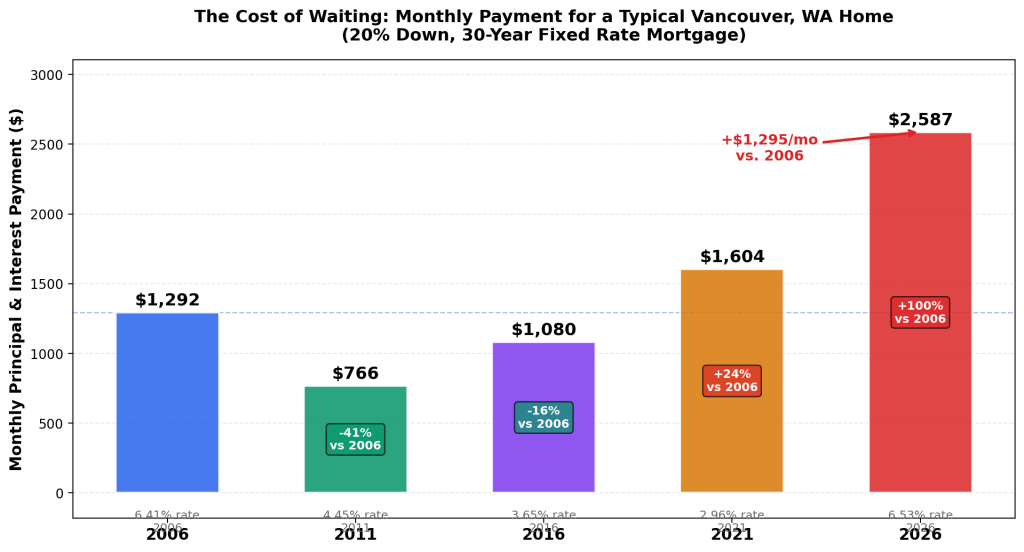
What a typical Vancouver home cost 5, 10, 15, and 20 years ago — and what it would
cost you monthly at each era’s mortgage rate
$2,587
Monthly principal & interest for a typical Vancouver home in 2026 — double the 2006 payment of $1,292
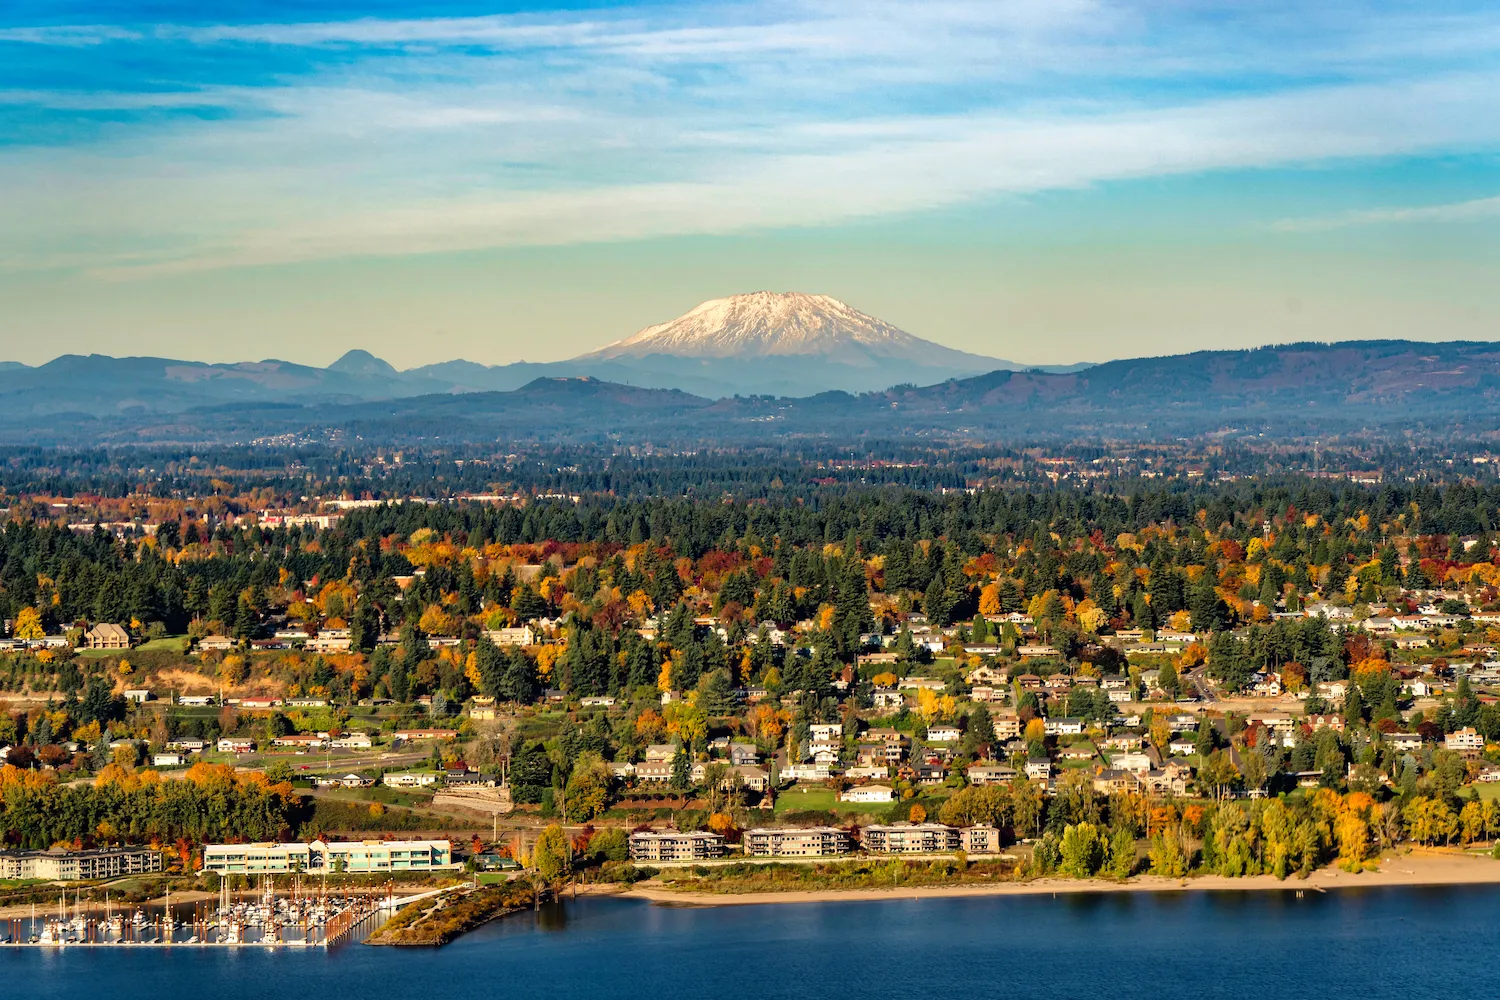
Twenty Years, Two Very Different Markets
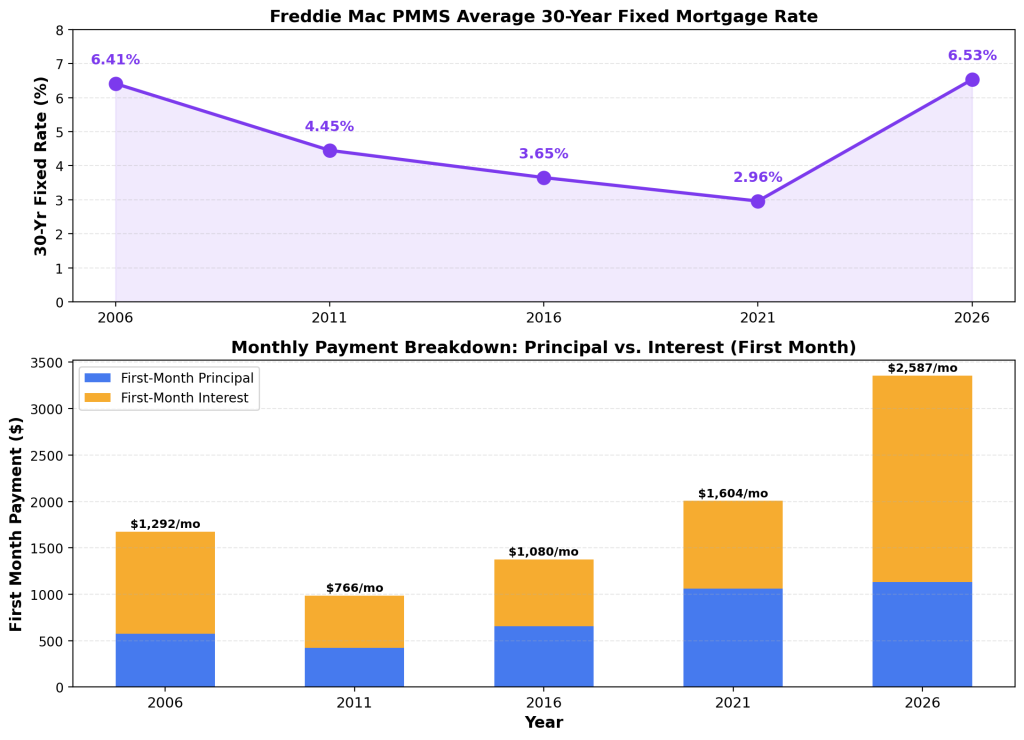
In 2006, the median home in the Vancouver, WA area sold for roughly $258,000, according to local broker Mike Lamb of Windermere Northwest Living, citing RMLS data (The Columbian, May 2026). Mortgage rates averaged 6.41% that year (Freddie Mac PMMS). With 20% down, a buyer faced a monthly principal-and-interest payment of about $1,292. Fast-forward to 2026: the Zillow Home Value Index for Vancouver sits at $510,577, RMLS reports a median sale price near $545,000 (Clark County Association of Realtors, May 2026), and the 30-year fixed rate is 6.53% (Freddie Mac PMMS, week of May 28, 2026). That same 20% down scenario now produces a $2,587 monthly payment — exactly double the 2006 figure.
The price alone tells a dramatic story, but the interest-rate roller coaster in between makes it more nuanced. Rates plunged after the financial crisis, bottomed out near 2.65% in January 2021, then surged past 7% by late 2022 before settling in the mid-6% range. For a few years, historically cheap debt masked just how fast prices were climbing. Now that rates have normalized, the full weight of two decades of appreciation is landing on monthly payments.
The Numbers at a Glance
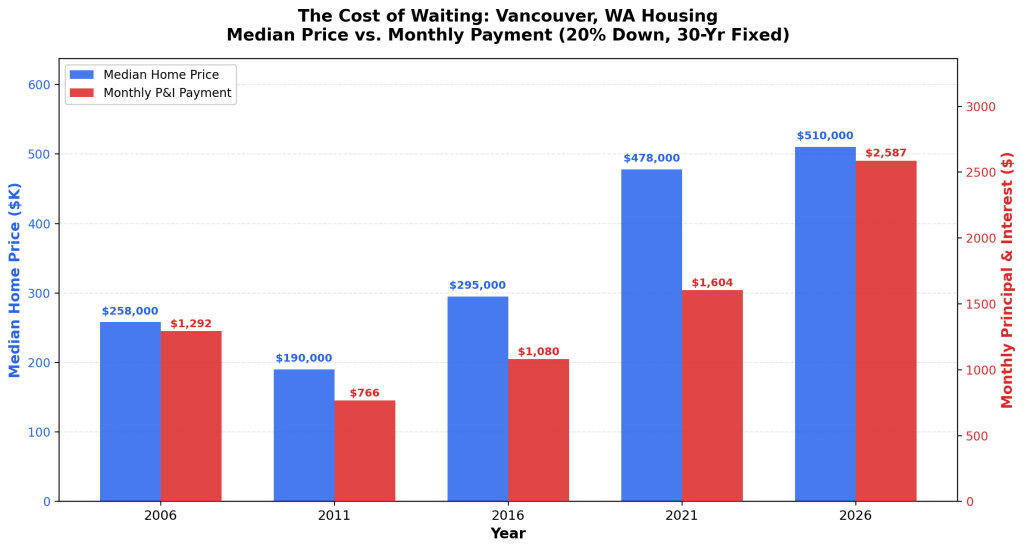
| Year | Median Price | 30-Yr Rate | 20% Down | Loan Amount | Monthly P&I |
|---|---|---|---|---|---|
| 2006 | $258,000 | 6.41% | $51,600 | $206,400 | $1,292 |
| 2011 | $190,000 | 4.45% | $38,000 | $152,000 | $766 |
| 2016 | $295,000 | 3.65% | $59,000 | $236,000 | $1,080 |
| 2021 | $478,000 | 2.96% | $95,600 | $382,400 | $1,604 |
| 2026 | $510,000 | 6.53% | $102,000 | $408,000 | $2,587 |
Era by Era: What Happened and Why
2006: The Pre-Crash Peak
Vancouver’s housing market peaked in mid-2006 through mid-2007, with the median sale price around $258,000 (Lamb, Windermere, cited in The Columbian, May 2026). East Vancouver’s 98684 ZIP code hit $275,000 in August 2007 before the decline set in (The Columbian, November 2014). At 6.41%, a buyer putting 20% down needed $51,600 in cash and committed to $1,292 per month in principal and interest. It felt expensive at the time — the market had already appreciated sharply from the early 2000s — but in retrospect, 2006 was a bargain on a monthly-payment basis compared with what came later.
2011: The Trough
The Great Recession hammered Clark County. By Q1 2011, the median had fallen to $194,200, down 8.1% year-over-year (RMLS, via The Columbian, May 2011). November 2011 saw an even lower median of $177,900 (The Columbian, November 2011). It was not until April 2012 that year-over-year prices rose for the first time since 2007, edging up to $190,000 (RMLS, via The Columbian, May 2012). Rates had fallen to 4.45%, making the monthly payment just $766 — the cheapest on this list in absolute dollars. Buyers with cash and courage got the deal of a generation. Most did not; confidence was shattered, lending standards were tight, and unemployment in Clark County hovered near 10%.
2016: Recovery Takes Hold
By August 2016, the Clark County median had climbed back to $293,500 and the market crossed $300,000 in September of that year (RMLS, via The Columbian, September 2016). The AWB Institute’s WCRER data puts the Q3 2016 Clark County median at $300,700, confirming the milestone. Mortgage rates averaged 3.65% that year, so the payment on a $295,000 home was $1,080 — still below the 2006 figuredespite a higher price, because rates had fallen nearly 3 percentage points. This was the sweet spot: prices had recovered but rates remained near historic lows. Buyers who acted in 2016 locked in the best cost-to-price ratio of any period in this analysis.
2021: The Pandemic Surge
COVID-19 ignited an extraordinary housing boom. The AWB Institute’s WCRER quarterly data shows Clark County’s median leaping from $446,900 in Q1 2021 to $492,200 by Q4 — a 10.1% jump in a single year. Rates averaged just 2.96%, hitting an all-time low of 2.65% in January 2021 (Freddie Mac PMMS). That sub-3% rate kept the monthly payment at $1,604, only 24% above the 2006 level even though the home price was 85% higher. The Columbian reported that Clark County’s median climbed to roughly $420,000 in 2020, then accelerated past $475,000 in 2021 as Portland refugees, remote workers, and rock-bottom rates collided with limited inventory (The Columbian, April 2025).
2026: The New Normal
Today the Zillow ZHVI for Vancouver stands at $510,577 (April 2026), down 0.6% year-over-year. The RMLS median sale price is $545,000 (CCAR, May 2026), and Freddie Mac’s 30-year fixed rate is 6.53%. The result: a $2,587 monthly payment on a typical home with 20% down. That is $995 more per month than 2021 and $1,295 more than 2006 — a 100% increase over two decades. The “lock-in effect” is real: homeowners who locked in 3% rates are reluctant to sell, constraining inventory and keeping prices elevated even as rates rise (The Columbian, May 2026).
What the Same Payment Buys Now
Here is the sting. A buyer who could afford $1,292 a month in 2006 purchased a $258,000 home. At today’s 6.53% rate, that same monthly payment supports a loan of just $204,000, which translates to a maximum purchase price of roughly $255,000 with 20% down — effectively the same nominal buying power as 2006, two decades later. The difference is that $255,000 no longer buys a typical Vancouver home; it buys a condo or a fixer-upper, if that. The median has simply left that price point behind, gaining 98% while wages in Clark County have risen roughly 55-60% over the same period (Bureau of Labor Statistics, Portland-Vancouver-Hillsboro MSA).
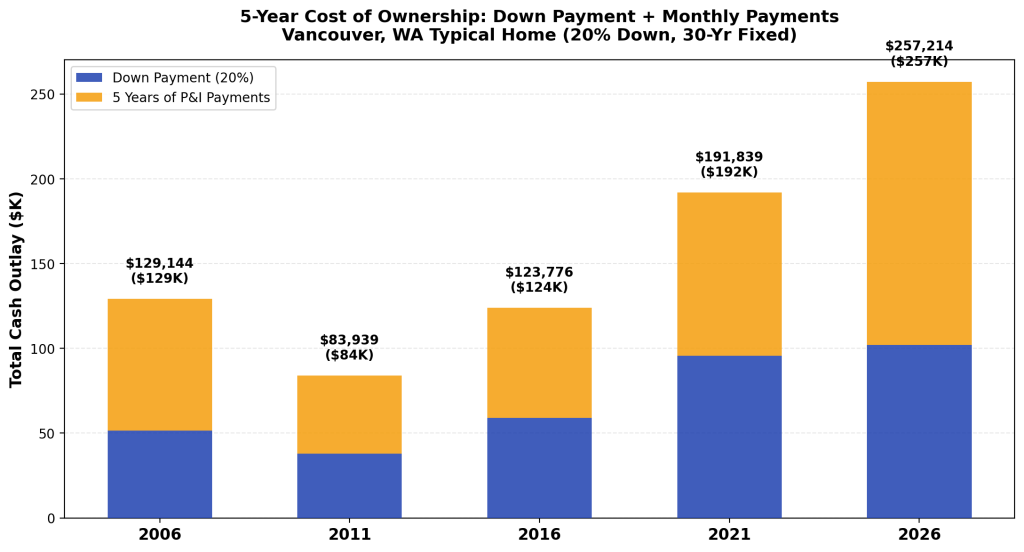
The Five-Year Toll
Cumulative cash out the door tells an even starker story. A 2026 buyer putting 20% down ($102,000) and making 60 monthly payments of $2,587 will have spent $257,200 in five years — just on down payment and principal-and-interest. That is $128,000 more than the 2006 buyer’s five-year total of $129,100, and $65,000 more than the 2021 buyer’s $191,800. The 2011 buyer, buying at the trough with rates at 4.45%, spent just $83,900 over five years. Importantly, these figures exclude property taxes (roughly 1.1% of assessed value in Clark County), insurance, maintenance, and any HOA dues, which add $400-$700 per month at current valuations.
So What?
The “cost of waiting” is not abstract. Between 2006 and 2026, the typical Vancouver home price rose 98% while the monthly payment to own one doubled. The brief window of sub-3% rates in 2020-2021 masked the sticker shock, but that window has closed. Today’s buyers face a combination — high prices and normalized rates — that produces the highest monthly carrying cost in the city’s modern history. For anyone still sitting on the sidelines, each year of waiting has historically meant a larger down payment, a higher monthly bill, or both. The one consolation: unlike 2006, the current market shows signs of stabilizing, with inventory rising and prices flat to slightly down year-over-year (Redfin, May 2026; Zillow ZHVI, April
2026). Whether that stability holds depends on where rates go next — and nobody has a crystal ball for that.
Sources & Metadata 1. Freddie Mac Primary Mortgage Market Survey (PMMS), annual averages and weekly data, 2006-2026. URL: https://www.freddiemac.com/pmms 2. Zillow Home Value Index (ZHVI), Vancouver, WA, April 2026 ($510,577). URL: https://www.zillow.com/home-values/48215/vancouver-wa 3. Redfin, Vancouver, WA Housing Market, median sale price $487K (3-month period ending May 2026). URL: https://www.redfin.com/city/18823/WA/Vancouver/housing-market 4. Clark County Association of Realtors (CCAR), Historical Market Stats, median sale price $549,000 (Jan-Apr 2026). URL: https://ccrealtors.com/blog/clark-county-wa-area-statistics 5. Mike Lamb, Windermere Northwest Living, cited in The Columbian (May 16, 2026): “In 2006, the median sale price was about $258,000.” URL: https://www.columbian.com/news/2026/may/16/real-estate-experts-starter-homes-are-things-of-the-past 6. The Columbian (May 15, 2012): “Median price for a home was $190,000 last month, up 0.1% from April 2011.” URL: https://www.columbian.com/news/2012/may/15/median-home-price-rises-for-1st-time-since-07 7. The Columbian (Nov 16, 2011): “Median price was $177,900 for all new and existing homes sold in Clark County, down 7.3%.” URL: https://www.columbian.com/news/2011/nov/16/clark-county-houses-sell-for-less8. The Columbian (Sep 15, 2016): “Clark County housing market hits $300K.” URL: https://www.columbian.com/news/2016/sep/15/clark-county-housing-market-hits-300k 9. The Columbian (Nov 16, 2014): East Vancouver 98684 peaked at $275,000 in August 2007. URL: https://www.columbian.com/news/2014/nov/16/home-values-slump-county-wide-recession 10. AWB Institute / Washington Center for Real Estate Research (WCRER), Clark County quarterly median resale price data (Q4 2015 – Q4 2025). URL: https://www.awbinstitute.org/indicator/median-home-resale-price 11. The Columbian (April 2025): Clark County median climbed to $420,000 in 2020, accelerated past $475,000 in 2021. URL: https://www.columbian.com/news/2025/apr/19/housing-post-covid-tight-market-low-inventory-in-clark-county 12. Bureau of Labor Statistics, Portland-Vancouver-Hillsboro MSA wage data, 2006-2026. URL: https://www.bls.go
About the Author
The Holloway Team is comprised of seasoned professionals dedicated to delivering unparalleled real estate experiences. Lauren, a top-producing agent at Compass, brings a wealth of expertise to ensure a smooth and stress-free experience, making your journey as effortless as possible. Henry, as our Data Analytics expert, provides actionable insights to drive informed decision-making in the real estate team. As a team we stand out as the preferred choice for clients seeking a seamless real estate experience in Southwest Washington.