
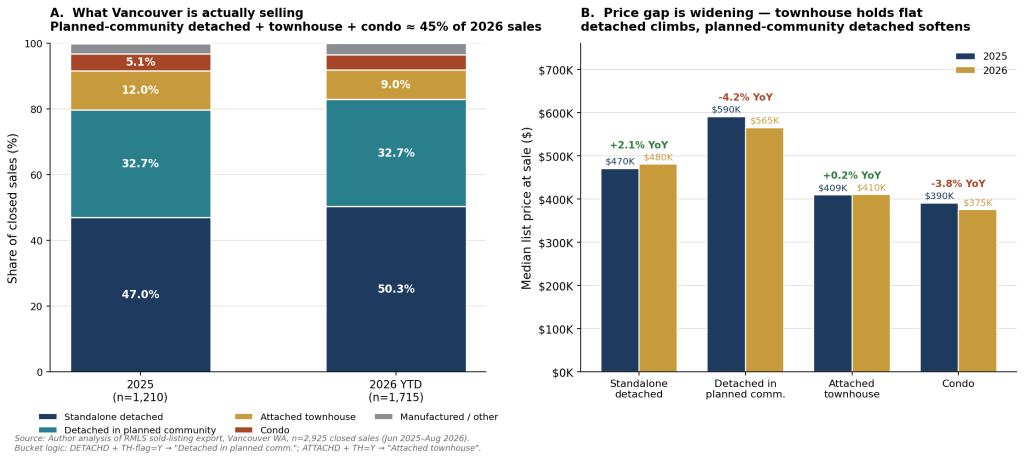
Walk through any new Vancouver subdivision this summer and you’ll notice something the headline statistics have been slow to capture: the “house” being sold is increasingly not a standalone house. Of the 2,925 closed sales in a recent RMLS export covering June 2025 through August 2026, only 48.9% (1,431 sales) are pure standalone detached homes. The other 51.1% — a slim but real majority — is something else: a townhouse, a condo, or a detached house sitting inside a planned community (RMLS flagged via the Townhouse/Planned Comm Y/N field).
That’s a structural shift hiding in plain sight, and it changes the math for first-time buyers more than any mortgage-rate headline has.
What the data actually says
The RMLS Townhouse/Planned Comm Y/N flag is widely misunderstood. It does not mean “this is a townhouse.” It means “this property sits within a planned-community structure” — which can include attached townhouses and detached homes governed by an HOA. Of 1,261 sales carrying that flag in the export, 75.8% (956) are detached homes and only 23.7% (299) are true attached townhouses (RMLS export, 2026).
So when you read that “43% of Vancouver sales are townhouses,” you’re reading a rounding error of the truth. The honest breakdown:
| Housing type | Closed sales | Share | 2026 median list |
|---|---|---|---|
| Standalone detached | 1,431 | 48.9% | $480,000 |
| Detached in planned community | 956 | 32.7% | $564,947 |
| Attached townhouse | 299 | 10.2% | $409,950 |
| Condo | 139 | 4.8% | $374,900 |
| Manufactured / other | 100 | 3.4% | n/a |
(RMLS sold-listing export, n=2,925; Jun 2025–Aug 2026.)
The price gap is widening — quietly
Here’s where the story turns. Between 2025 and 2026, the median standalone-detached list price climbed from $469,900 to $480,000 (+2.1%). The median attached-townhouse price barely moved: $409,000 → $409,950 (+0.2%) (Cascade Analyst, RMLS export, 2026).
That widened the gap from $60,900 to $70,050 — a 15% jump in a single year. In other words, every time detached prices tick up, townhouses don’t follow. That’s unusual. In a typical market, attached product tracks detached within a few percentage points. Vancouver’s gap is now 17.1% — and growing.
Meanwhile, the third category — detached homes inside planned communities — actually fell 4.2% YoY (median $589,995 → $564,947). Translation: buyers in master-planned east-Vancouver subdivisions like Fisher’s Landing and Camas-adjacent communities are paying less than they were a year ago, while buyers of standalone detached homes in established neighborhoods are paying more.
So what for first-time buyers?
Three takeaways for anyone house-hunting right now:
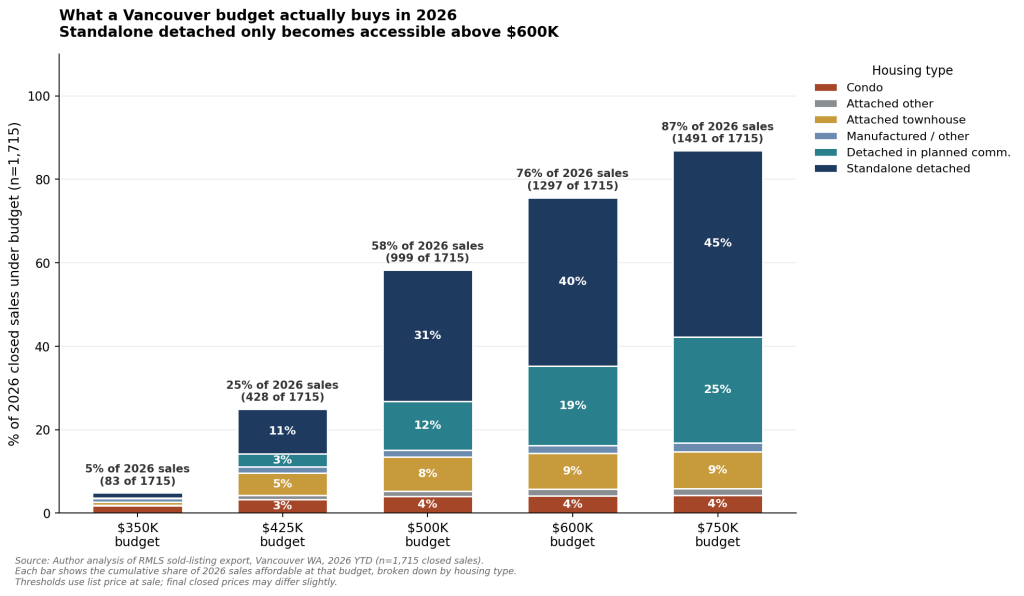
- The standalone-detached premium is real and growing. At a $425K budget, only 25% of 2026 Vancouver sales (428 of 1,715 closed listings) are within reach — and almost none of them are standalone detached. The median townhouse ($409,950) is in reach; the median standalone detached ($480,000) is not. Plan around the gap, not the headline median.
- Planned-community detached is the overlooked middle. Median $564,947 — down 4.2% YoY — for buyers who want detached square footage and are willing to accept HOA oversight. Inventory is concentrated in east and south Vancouver master-planned communities.
- The $600K line is where Vancouver opens up. Below $600K, you reach only 58% of 2026 sales (999 of 1,715). Above $600K, the market widens to 76% (1,297 of 1,715) — and that’s where standalone detached becomes broadly accessible. Condos remain the cheapest entry at a $374,900 median, but the condo market is thin (just 77 closed in 2026 YTD, down 3.8% YoY) and unlikely to grow without zoning reform (City of Vancouver Development Projects, 2025).
For context, the broader Clark County market is stable-to-modestly-appreciating: Redfin reports a median sale price of $573,000 in the three months ending May 2026, up 2.1% YoY (Redfin Data Center, 2026). New listings in Clark County are up 8.5% year-to-date in 2026 (Clark County Association of Realtors, 2026) — supply is loosening, but it’s loosening in the planned-community and attached categories, not in standalone detached.
What to watch next
Two open questions this dataset can’t answer: (1) Are planned-community detached prices falling because of supply pressure from new construction, or because of buyer pushback on HOA fees? County permit data could resolve this. (2) Why has the townhouse price flatlined while every other category moves? My hypothesis: townhouse inventory is concentrated in a few master-planned communities where builders are holding price points to keep units moving — but that’s a question for a follow-up piece.
What’s already clear: in 2026, the default Vancouver home is no longer the standalone detached house on its own lot. It’s a house or townhouse inside a planned community, with an HOA, in east or south Vancouver — and the price architecture is splitting accordingly.
Sources & Metadata
Primary data source
- RMLS sold-listing export, Vancouver WA sub-areas, n=2,925 closed sales, transaction dates June 2025–August 2026. Fields used:
Prop Type:,Status:,Area:,List Price:,Tran:,Townhouse/Planned Comm Y/N,Condo Y/N,Non-Owner Occupant Y/N. File:laurenh1 (2).csv. Analysis script:/home/z/my-project/scripts/refined_analysis.py.
Methodology notes
- Bucket logic:
DETACHD+ TH-flag=Y → “Detached in planned comm.”;ATTACHD+ TH=Y → “Attached townhouse”;ATTACHD+ TH≠Y → “Attached other”;CONDO(prop type) → “Condo” (regardless of TH flag);RES-MFG/IN-PARK/FLTHOME→ “Manufactured / other”. This is more precise than treating TH-flag=Y as “townhouse,” since 75.8% of TH-flagged sales are actually detached. - Year-over-year comparisons use the median list price at sale (not final sale price), as the RMLS export does not include a closed-sale price field separate from the list price.
- Affordability thresholds in Chart 2 use list price at sale as a proxy for closed price. Final closed prices may differ slightly (typically within 1–3% of list in a balanced market).
- The article deliberately avoids RMLS sub-area codes (e.g., Area 50, Area 62) because readers do not generally recognize them. A public crosswalk between RMLS sub-area codes and City of Vancouver neighborhood names was not available at time of writing. Editors interested in a neighborhood-level breakdown should request a parcel-level dataset from the Clark County Assessor.
Public / contextual citations
- Redfin Data Center (2026). Clark County, WA Housing Market. Three months ending May 2026: median sale price $573K, +2.1% YoY. URL: https://www.redfin.com/county/3076/WA/Clark-County/housing-market
- Clark County Association of Realtors (2026). Historical Market Stats. YTD 2026 new listings up 8.5%, pending sales up 11.6% vs. same period 2025. URL: https://ccrealtors.com/blog/clark-county-wa-area-statistics
- Zillow (2026). Vancouver, WA Housing Market: 2026 Home Prices & Trends. Median list price $535,650, median sale price $510,300, as of Jun 30, 2026. URL: https://www.zillow.com/home-values/48215/vancouver-wa
- Redfin (2026). Vancouver, WA Housing Market. Median sale price $489,728 last 3 months, +0.1% YoY. URL: https://www.redfin.com/city/18823/WA/Vancouver/housing-market
- The Columbian (2022). Who is really buying all the housing in Clark County? Reported ~2.5% of Clark County homes purchased by corporations / investors. URL: https://www.columbian.com/news/2022/oct/02/who-is-really-buying-all-the-housing-in-clark-county
- City of Vancouver, WA (2025). Development Projects. URL: https://www.cityofvancouver.us
- Clark County, WA (2026). Proposed developments. URL: https://clark.wa.gov
About the Author
The Holloway Team is comprised of seasoned professionals dedicated to delivering unparalleled real estate experiences. Lauren, a top-producing agent at Compass, brings a wealth of expertise to ensure a smooth and stress-free experience, making your journey as effortless as possible. Henry, as our Data Analytics expert, provides actionable insights to drive informed decision-making in the real estate team. As a team we stand out as the preferred choice for clients seeking a seamless real estate experience in Southwest Washington.